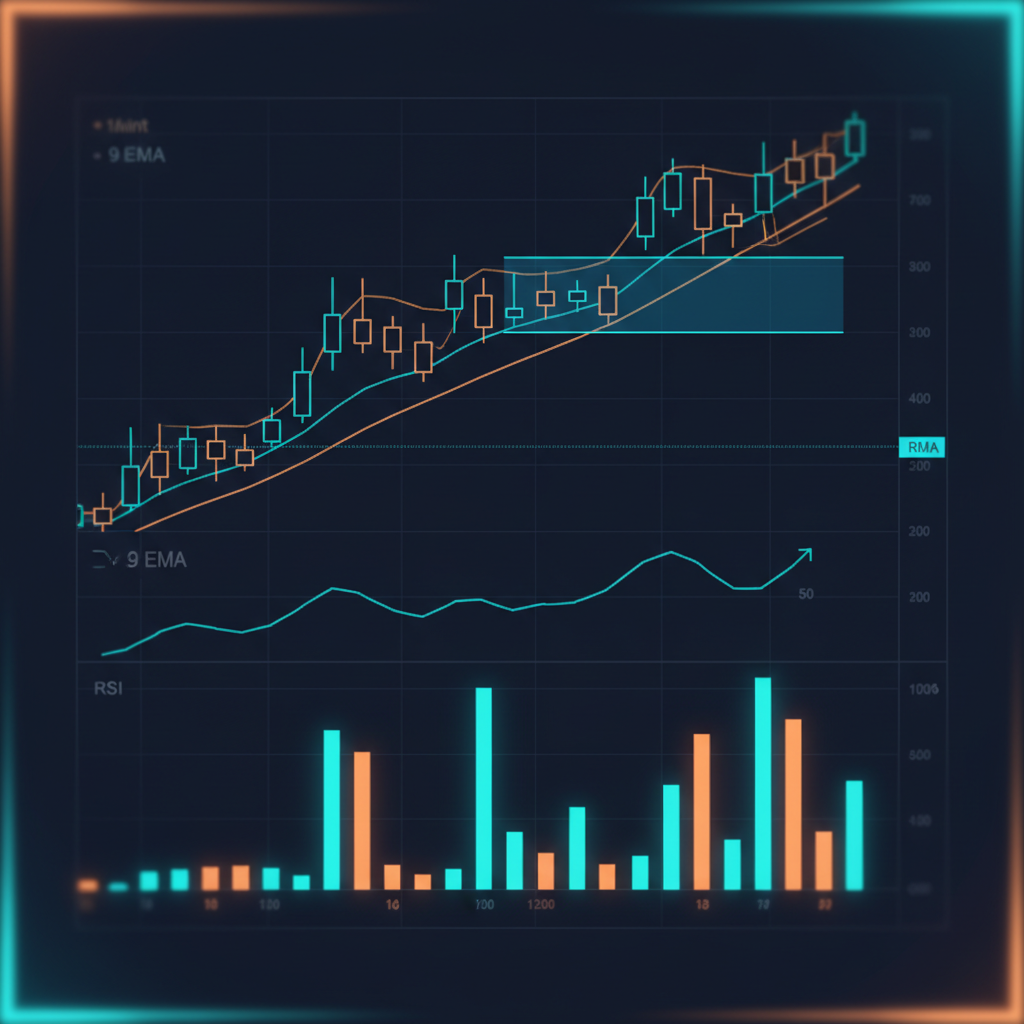

Technical Analysis for Crypto Traders
Learn to read price charts, identify key patterns, and use technical indicators to make better trading decisions in crypto markets.
Technical Analysis for Crypto Traders
Technical analysis (TA) is the study of historical price data to forecast future price movements. While not a crystal ball, TA gives traders a structured framework for decision-making.
Every candlestick represents a time period and shows:
- Open: Price at period start
- Close: Price at period end
- High / Low: Price range during the period
- Green candle: Close > Open (bullish)
- Red candle: Close < Open (bearish)
Support is a price level where buying pressure historically halts a decline. Resistance is where selling pressure historically halts a rally.
How to identify them:
- Previous swing highs and lows
- Round numbers ($10,000, $50,000)
- High-volume price clusters
- SMA (Simple): Average of N periods
- EMA (Exponential): Weighted toward recent prices
- Golden Cross: 50MA crosses above 200MA → bullish signal
- Death Cross: 50MA crosses below 200MA → bearish signal
Measures momentum on a 0–100 scale.
- Above 70: Overbought (potential reversal)
- Below 30: Oversold (potential bounce)
- Divergence: Price makes new high but RSI doesn't = weakness
Shows relationship between two EMAs (12 and 26 period).
- MACD crossing above signal line = buy signal
- MACD crossing below signal line = sell signal
Price channel 2 standard deviations from the 20MA.
- Price touching upper band = potentially overbought
- Price touching lower band = potentially oversold
- Squeeze: Bands narrow → volatility incoming
- Cup and Handle: Rounded bottom + small pullback before breakout
- Inverse Head & Shoulders: Three bottoms, middle lowest
- Ascending Triangle: Flat resistance + higher lows
- Head & Shoulders: Three peaks, middle highest
- Descending Triangle: Flat support + lower highs
- Double Top: Two peaks at same resistance
Volume confirms price moves:
- Breakout on high volume = strong move
- Breakout on low volume = likely to fail (fakeout)
- Declining volume in a trend = trend weakening
| Trader Type | Timeframes Used | |---|---| | Scalper | 1m, 5m, 15m | | Day Trader | 1h, 4h | | Swing Trader | 4h, Daily | | Position Trader | Daily, Weekly |
- Trading against the macro trend
- Ignoring volume
- Using too many indicators (analysis paralysis)
- No stop-loss discipline
Remember: TA is probabilistic, not deterministic. Always combine it with sound risk management.
Found this guide helpful? Share it with others